Coding
Ensuring Geospatial Accuracy: CRS Assignments and Transformations
This post aims to provide a comprehensive guide on correctly assigning coordinate reference systems (CRS) and handling spatial data with different CRS configurations. It will demonstrate how to project/transform geodata and their coordinates from one CRS to another, ensuring that all spatial objects (maps, rasters, shapefiles) align accurately in a common reference frame.
Download Spatial Data from the Berlin Geoportal Data Base in R
Learn how to download WFS (vector) data and ATOM (raster) data from the Berlin Geoportal data base using our custom functions `download_fisbroker_wfs()` and `download_fisbroker_atom()`.
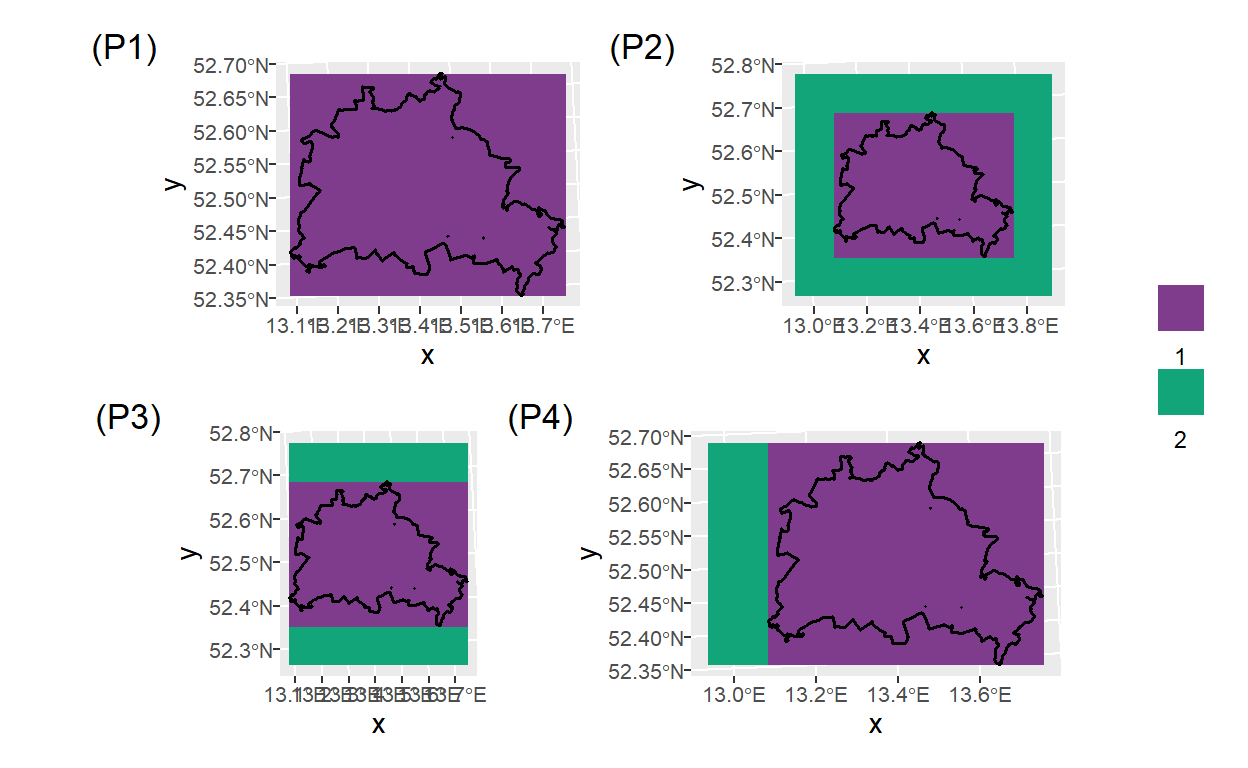
Raster Operations
Learn how to 1) obtain a template raster from the `{d6geodata}` package, 2) expand the raster in different ways, 3) rasterize vector data, and 4) extract information from a raster using vector data. The methods described involve the use of packages like `{terra}` and `{sf}`, and include examples and plots to illustrate the processes. Additionally, we show how to use the `{tidyterra}` package for plotting raster data with `{ggplot2}`.
How to Import Tabular, Plain-Text Data Files
Learn how to import (and export) various tabular data file formats such as CSV, TXT, and XLSX using a range of packages such as {utils}, {vroom}, {readr}, {data.table}, {readxl}, and {rio}. The article also includes best practices when specifying paths and a quick discussion on handling R specific formats such as RDS and Rdata.
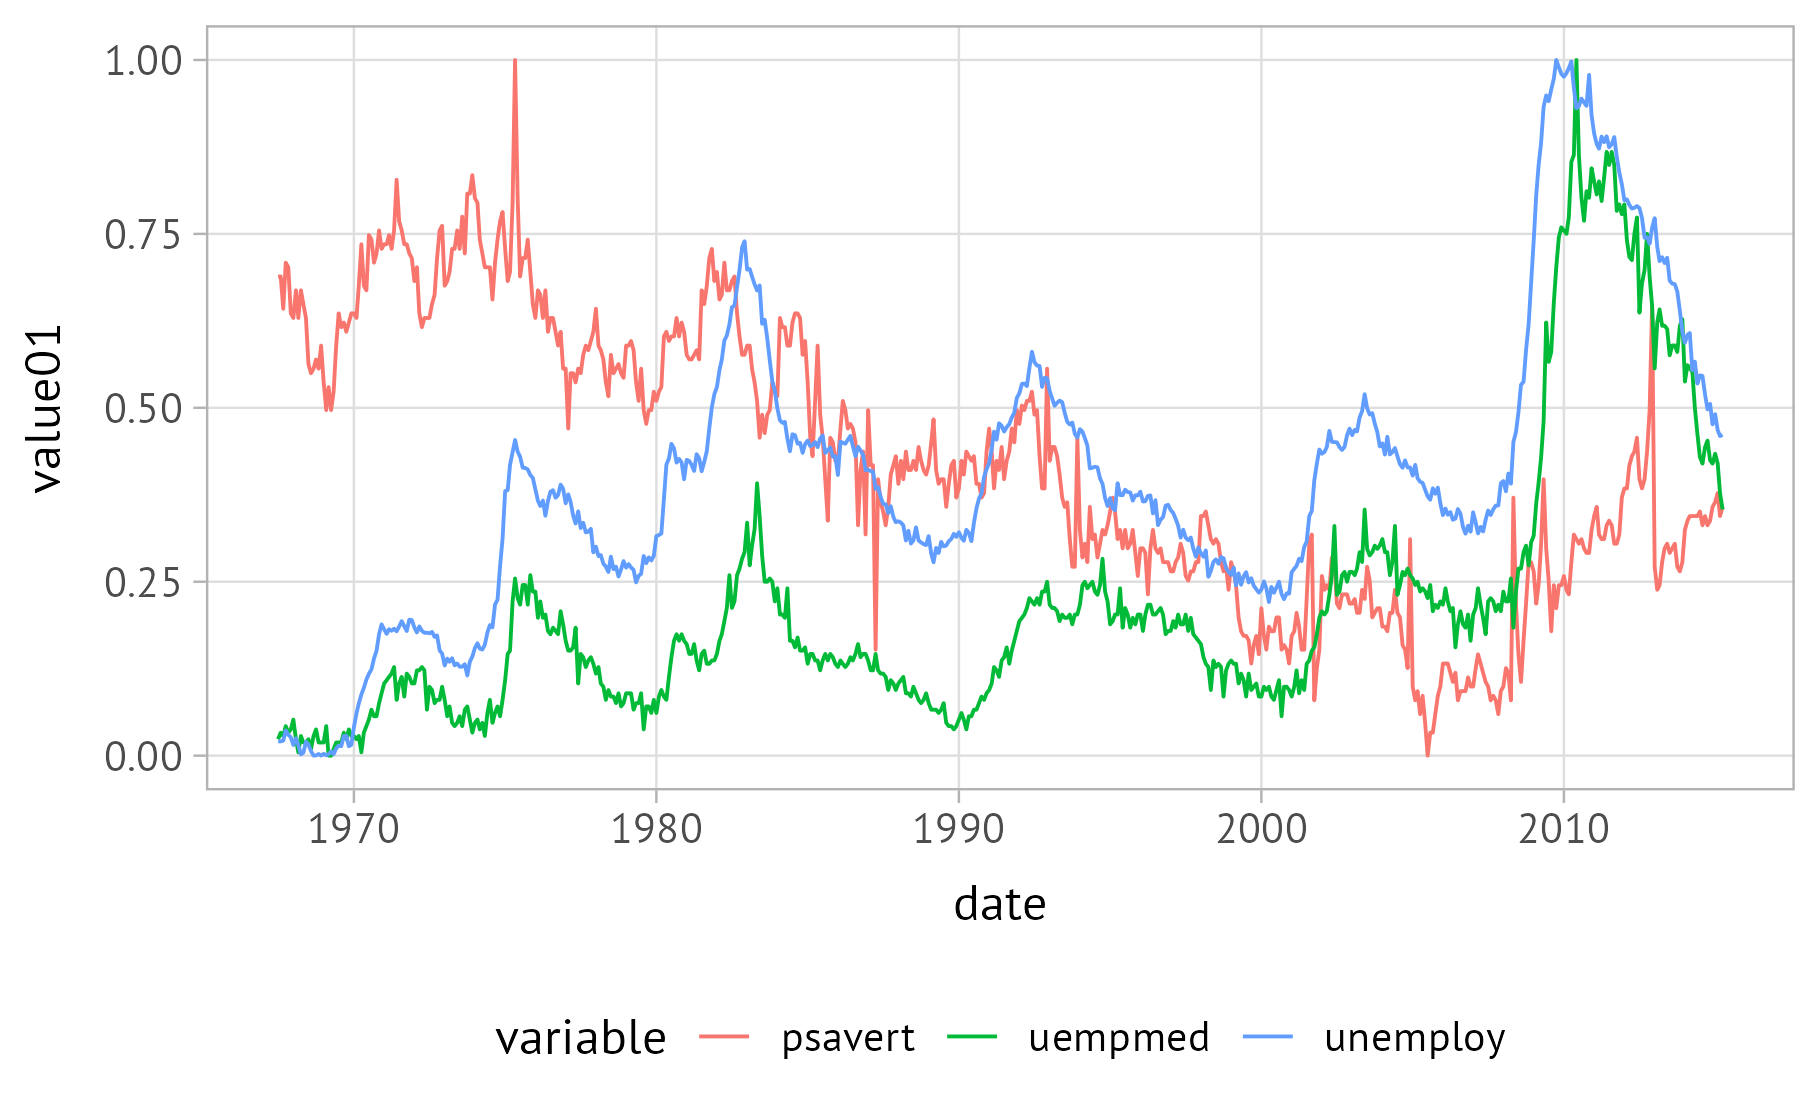
Our Corporate D6 ggplot2 Theme
Learn how to use the theme_d6() featured in our {d6} package to create figures that match our lab identity. The theme function comes with a set of helpful additional options to simplify customization of our corporate D6 theme while ensuring consistency.
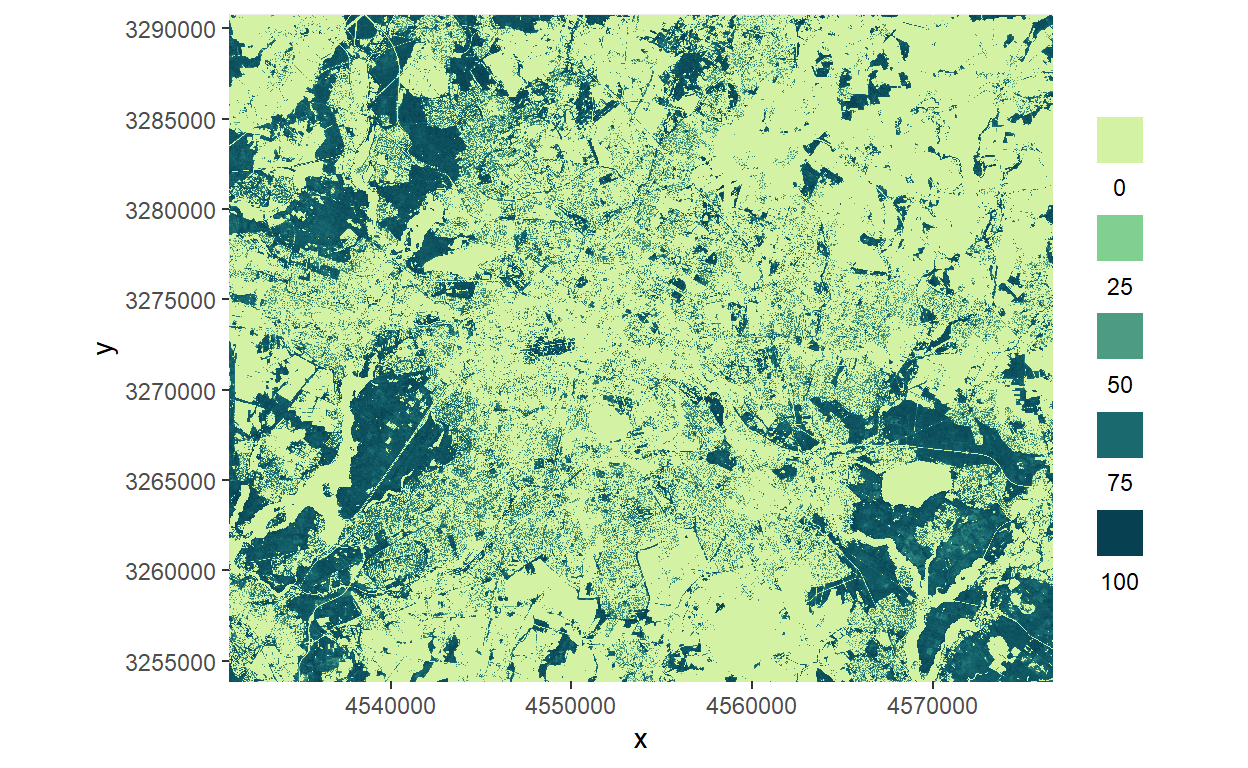
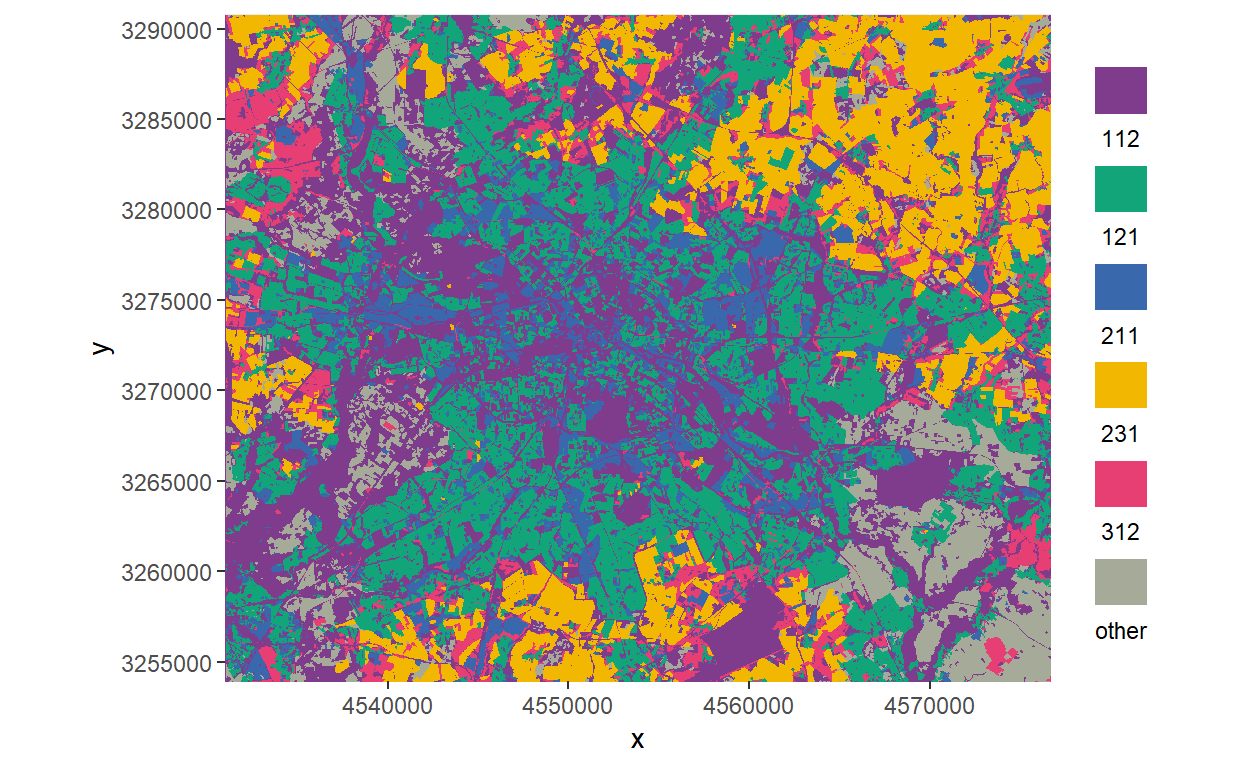
Categories in Raster Data
Learn how to work with categorial raster data and how to transform the rastervalues into a numerical values using terra package.
Scientific Writing Tips
Find here some guidelines how to write and structure a scientific introduction, a scientific discussion or prepare a response letter for your revisions. You will find three pdf documents, one for each section.
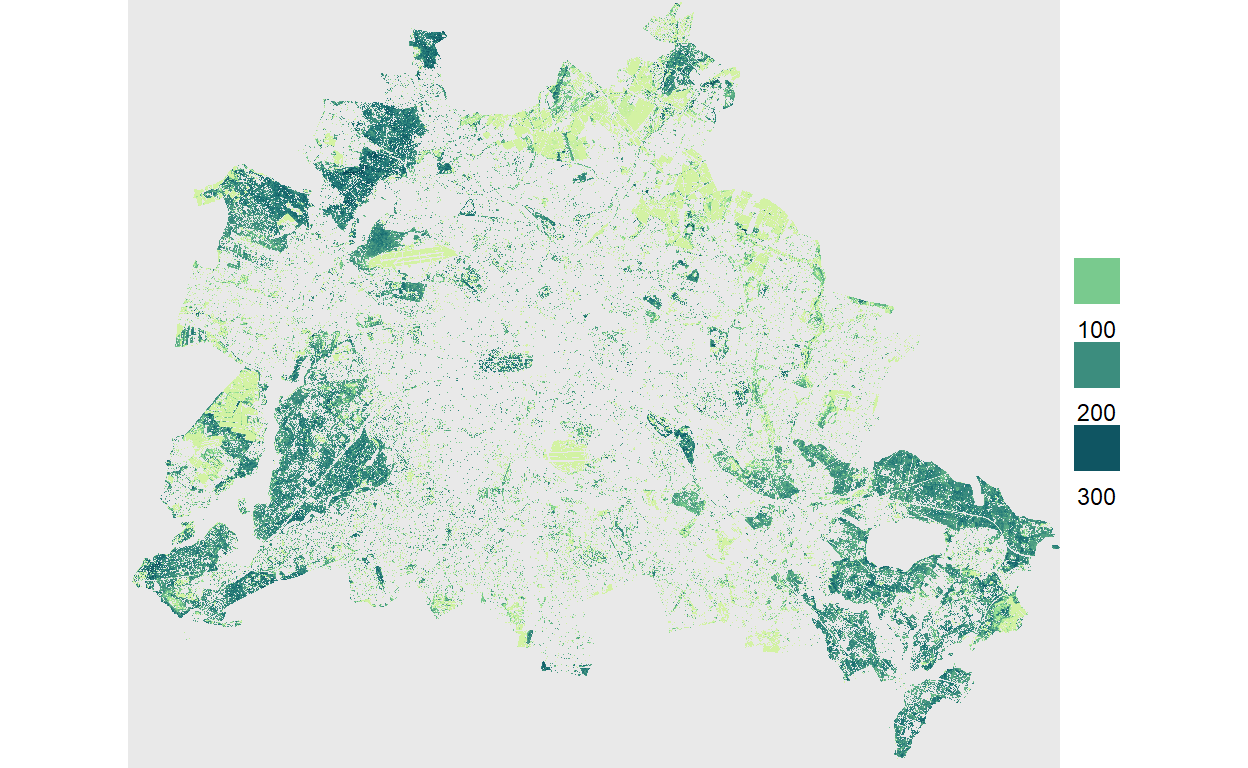
Clipping a Raster to a Specific Area
Learn how to use a clipping mask to extract a portion of a raster, based on a template extent. In this example we show you how to clip a raster map to the extent and borders of Berlin boundaries.
How to Make a Blogpost: a Brief Introduction
Learn how to contribute to the wiki section of the Ecological Dynamics Department webpage. If you think you have an important information, script, package or just a piece of code that might be interesting for your colleagues, consider to turn it into a blogpost for our webpage.

ggplot2 Workflow Tips
Learn how to efficiently use the powerful graphics library {ggplot2} by avoiding repeated code and manual adjustments. You will learn how to define your themes globally and how to use the {patchwork} package to create multi-panel plots with automated numbering and combined legends.
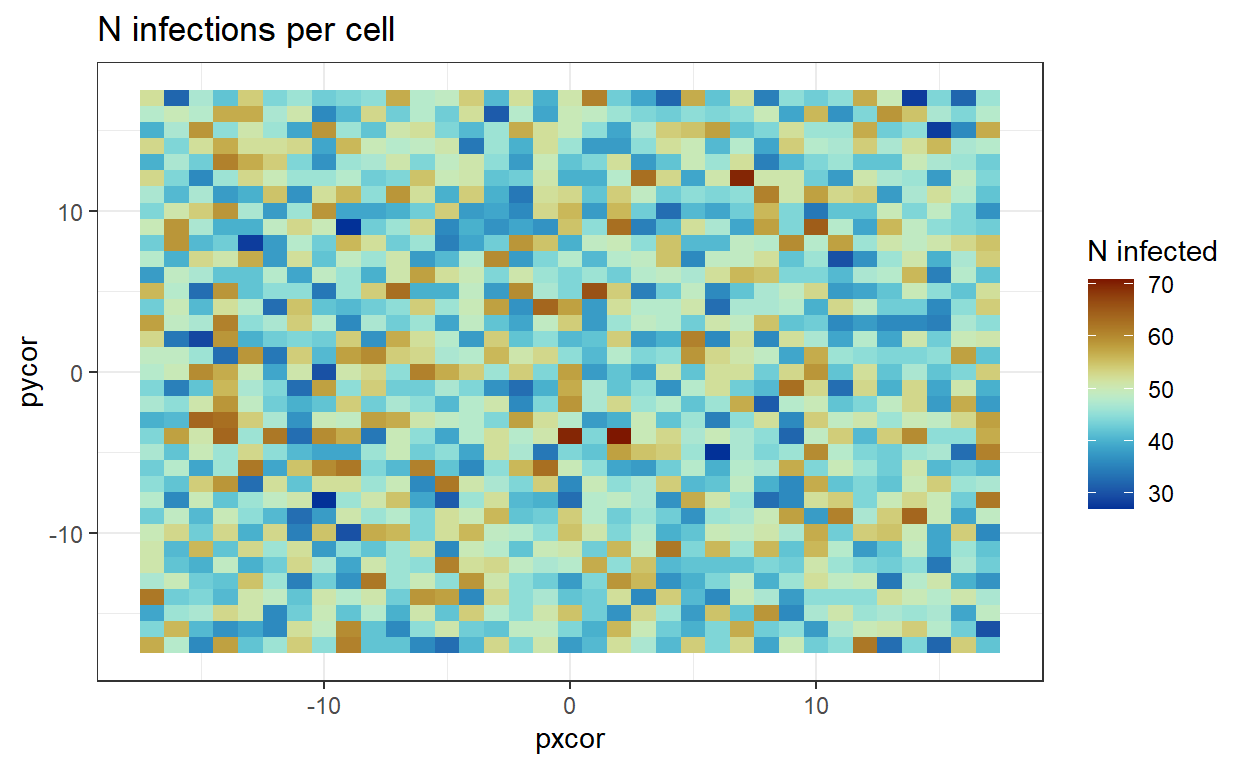
Netlogo Turtle Spatial Projection
Learn how to transform the relative coordinates of the individuals from Netlogo into coordinates from real maps. This code is especially designed for spatially explicit netlogo models that were set to store the individual coordinates (xcor, ycor) in the output for the turtle data.
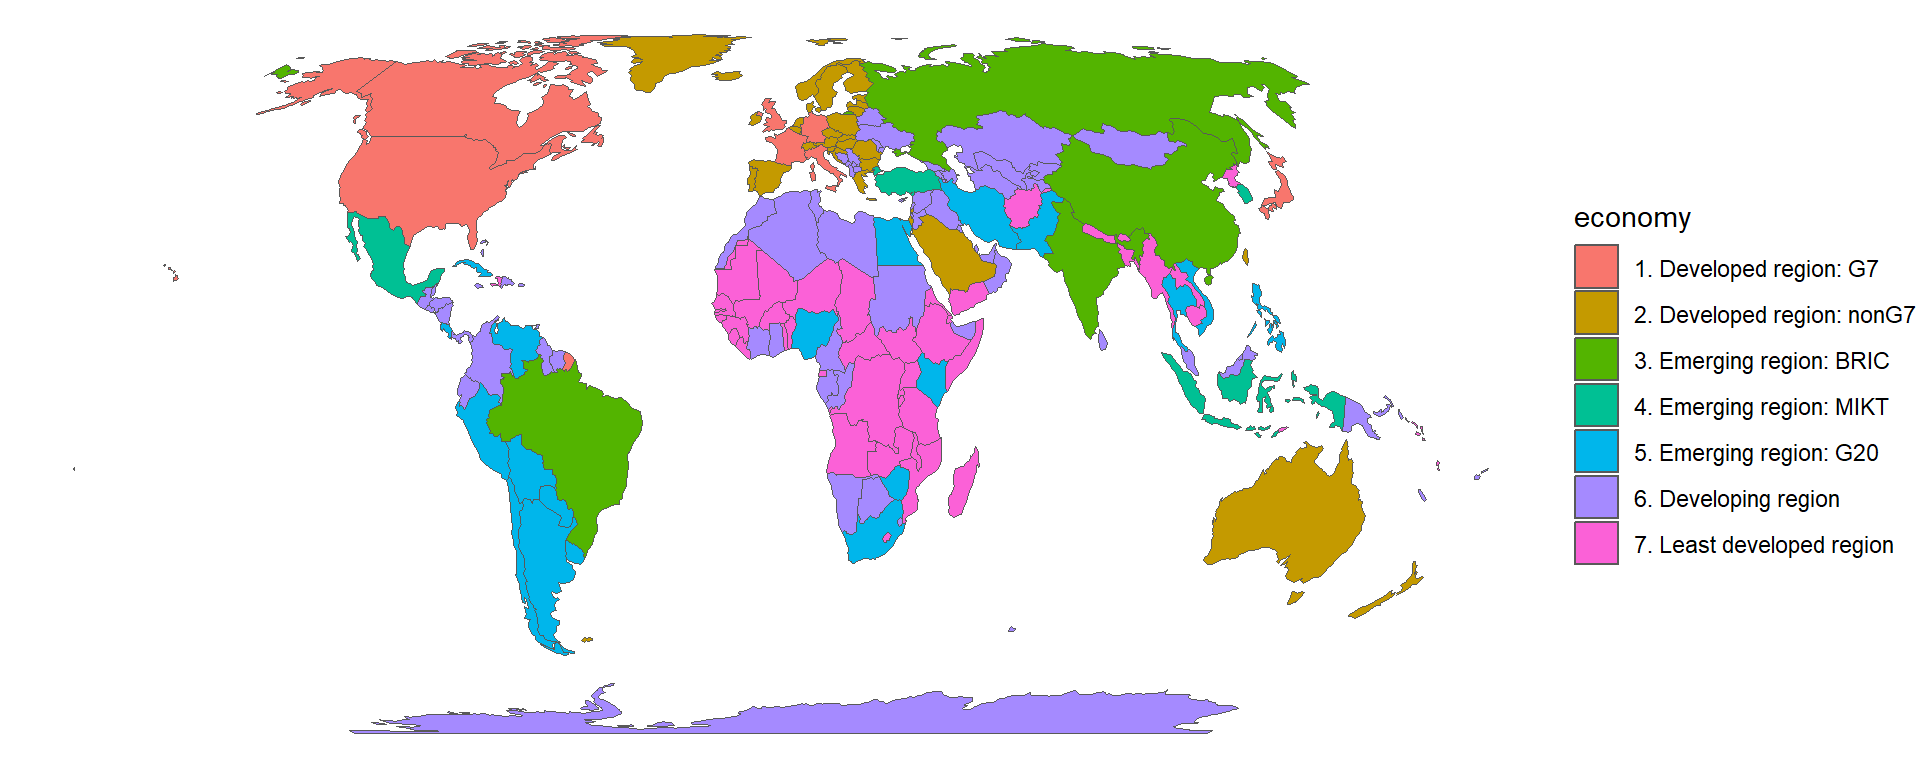
Spatial Data Sources in R
Learn how to use a suite of R packages to download various spatial data sources. This guide illustrates how to download data of countries, physical objects, and cultural properties as vector or raster objects that can be assessed from within R.
Manage Spatial Data from Our Geodata Archive
Learn how to use the {d6geodata} R package that provides functions for accessing data from the Geodata archive of the Department of Ecological Dynamics. The two functions `geo_overview()` and `get_geodata()` are the main components for all members of our Department. Several other functions are within this package but only meant to be used by the Geodata Manager of the Department.
Download Spatial Data from the Berlin FIS-Broker Data Base in R
Learn how to download WFS (vector) data and ATOM (raster) data from the Berlin fisbroker data base using the our custom functions `download_fisbroker_wfs()` and `download_fisbroker_atom()`.
Run NetLogo Simulations in R
Learn how to use the {NLRX} R package to run NetLogo models/experiments. This guide gives a brief overview of the basic functionality, how to quickly apply it to a model and shows some example (visual) outputs.
Coding Basics 2: Loops and Functions
A brief introduction into various coding basics for people who are beginning to use R or other programming languages. In this session, we will be looking at both functions and loops in R, with examples from NetLogo and C++ and go over use and basic functionality.
Coding Basics 1: General Tips
A brief introduction into various coding basics for people who are beginning to use R or other programming languages. In this session, we will be looking at some general tips and information that helps creating good and understandable code. Specifically we are looking at naming conventions, indentations and commenting of code.
Turning Equations into Functions in NetLogo
While some programming languages, such as R, offer many native functions, others (e.g., NetLogo) offer fewer built-in options. However, users can create their own functions easily. Here, we will show the example of a Weibull density distribution function & associated cumulative density distribution function—both not yet implemented in NetLogo or NetLogo extensions.
imageseg
imageseg is an R package for deep learning image segmentation using the U-Net model architecture by Ronneberger (2015), implemented in Keras and TensorFlow. It provides pre-trained models for forest structural metrics (canopy density and understory vegetation density) and a workflow to apply these on custom images
Isorix
IsoriX is an R package aiming at building isoscapes using mixed models and inferring the geographic origin of organisms based on their isotopic ratios
Manage Camera Trap Data in R
Learn how to use the {camtrapR} R package for streamlined and flexible camera trap data management. It should be most useful to researchers and practitioners who regularly handle large amounts of camera trapping data.
Simulate Neutral Landscape Models
Learn how to use the {NLMR} R package to simulate neutral landscape models (NLMs), a common set of various null models for spatial analysis and as input for spatially-explicit, generic models.
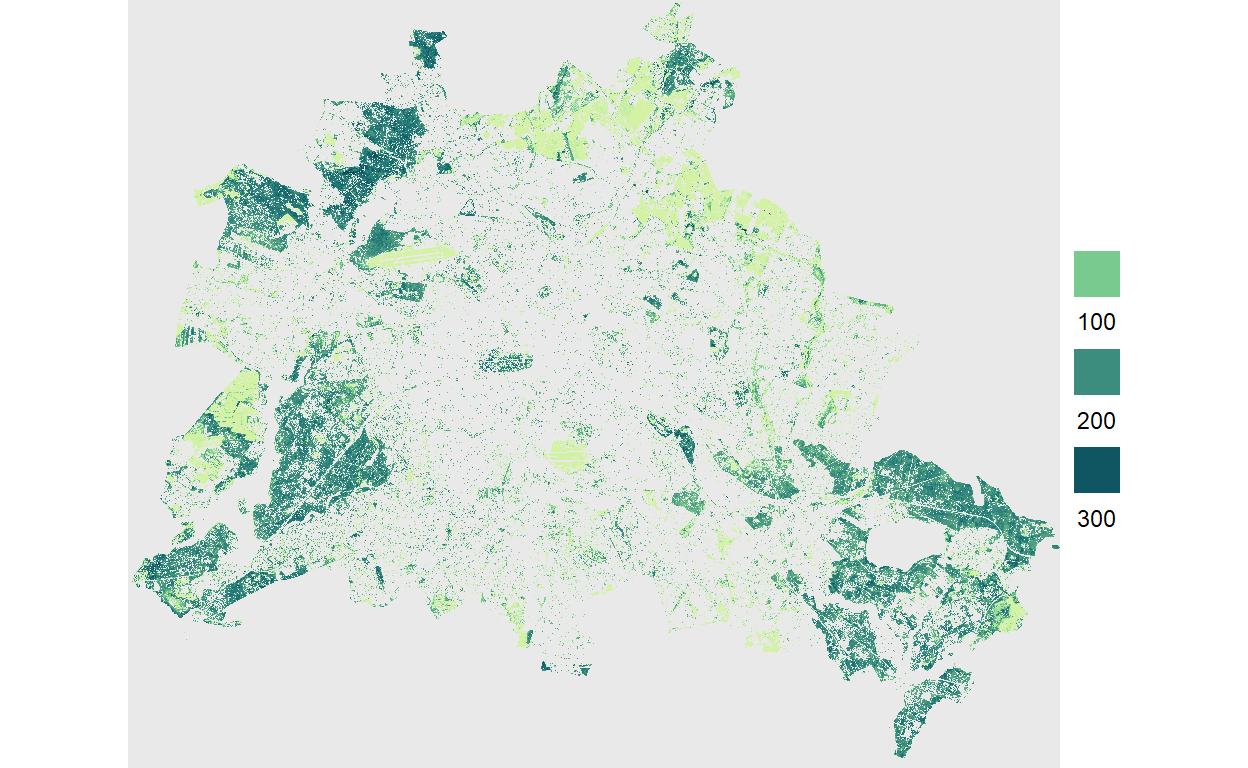
Spatial Datasets and Template Maps for Berlin
Learn how to use the {d6berlin} R package that provides spatial data sets and template maps for Berlin with carefully chosen and aesthetically pleasing defaults. The template maps include Berlin districts, green spaces, imperviousness levels, water bodies, district borders, roads, metro stations, and railways. Templates maps are created with a {ggplot2} wrapper function with the utility to add an inset globe with a locator pin, a scalebar, and a caption stating the data sources.

Simplify Workflows of D6 Research Projects
Learn how to use the {d6} package to follow the project workflow within the department “Ecological Dynamics” at the Leibniz Institute for Zoo and Wildlife Research. The package functionality allows you to set up a standardized folder structure, to use templates for standardized reports, and provides a corporate theme for ggplot2 and some helpful utility functions.