Categorical rasters, such as land cover classes, can be tricky to deal with in R. Imagine you get a raster (in {terra} the object is called spatRaster) with categories.
In {terra}, those categories are stored as labels. Additionally, a raster layer can have multiple labelling columns, in a way that we can activate the column with the information we want at the moment. Furthermore, we might want to operate with our rasters, for which we may need numerical values.
First, we are going to see how to change or activate the labels to show in the categorical rasters. Then, we are going to see how to effectively transform this into numerical values.
The {Terra} changed the way how to do this compared to the {raster} package. Here are some tricks.
Load {terra} package
Create example data
We create a categorical raster as an example for our code
# a simple spatRaster with 3 categories
ras <- rast(matrix(rep(c("forest", "farm", "urban"), each = 3), nrow = 3, ncol = 3))

ras
class : SpatRaster
dimensions : 3, 3, 1 (nrow, ncol, nlyr)
resolution : 1, 1 (x, y)
extent : 0, 3, 0, 3 (xmin, xmax, ymin, ymax)
coord. ref. :
source(s) : memory
categories : label
name : lyr.1
min value : farm
max value : urban plot(ras)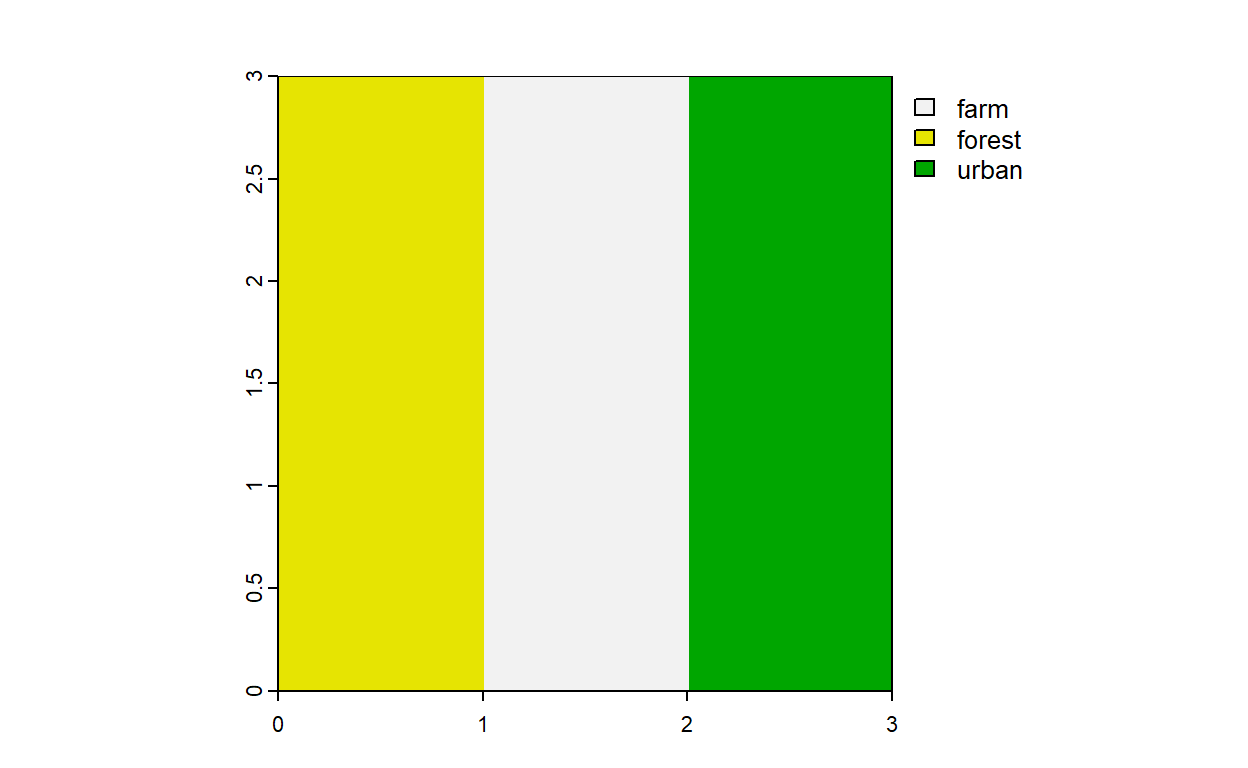
Our new raster has the categories we gave it as the labels in the plot. However, internally this categories as associated with “Values”. To see how the internal “Values” relate to the label, we can call the table of categories for the raster value
# this shows the categories and the numeric internal representative numeric value it automatically gets.
cats(ras)
[[1]]
value label
1 1 farm
2 2 forest
3 3 urbanThis is something like a “master table” that tell the raster what to show. Now that we have access to it, we can transform it and add information as needed, for example reclassifying the classes of the data, and relink this information back to the raster object.
Add categorical column
lets say you want to reclassify the data, you can add another column by using this:
recl_df <- cbind(as.data.frame(cats(ras)),
                 data.frame(new_label = c("d", "f", "e"))) # I shuffled the characters to show the difference in the end


# the function `categories` links the new table we created to the raster and "activates" the column we want to use.
# In this case the new added column called new_label. The column order is counted as the position of the column AFTER the Value column
ras_new_cat <- categories(ras,
                          layer = 1,
                          value = recl_df,
                          active = 2) # column 2 (do not count the value column! It has to be numeric)

# now our raster has two entries for the categories. We can select which one to show.
ras_new_cat
class : SpatRaster
dimensions : 3, 3, 1 (nrow, ncol, nlyr)
resolution : 1, 1 (x, y)
extent : 0, 3, 0, 3 (xmin, xmax, ymin, ymax)
coord. ref. :
source(s) : memory
categories : label, new_label
name : new_label
min value : d
max value : e plot(ras_new_cat)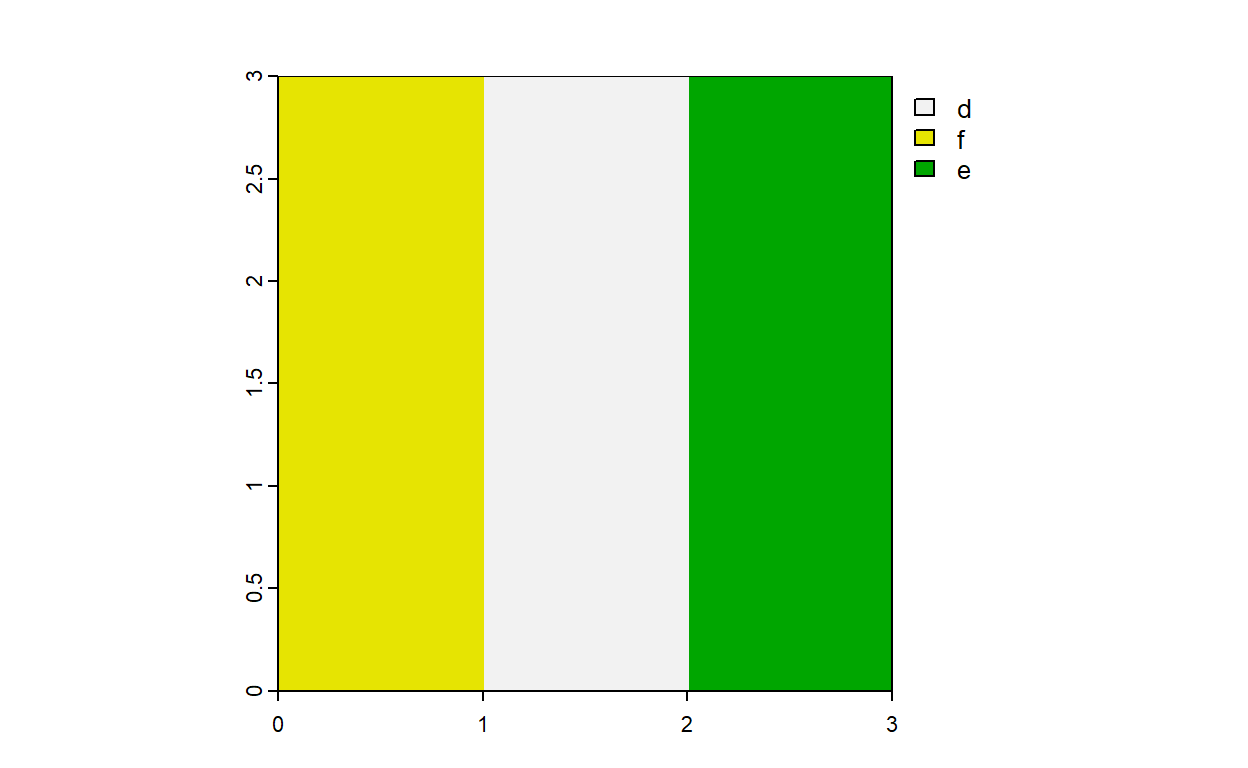
If we want to go to the old labels, we just need to activate the old labels by indicating the column they are stored in {activeCat} function

Add numerical column
Let’s say we want to reclassify the spatRaster with a numeric value, we have to take one more step First, we add a column with the numerical value we want to our categorical raster “master table”
recl_df_num <- cbind(as.data.frame(cats(ras_new_cat)),
                                   new_value = c(5, 4, 6))

# In this case the fourth (numeric) column will be activated

ras_new_cat_2 <- categories(ras,
                          layer = 1,
                          value = recl_df_num,
                          active = 3) # column 4 (do not count the value column! It has to be numeric)

plot(ras_new_cat_2)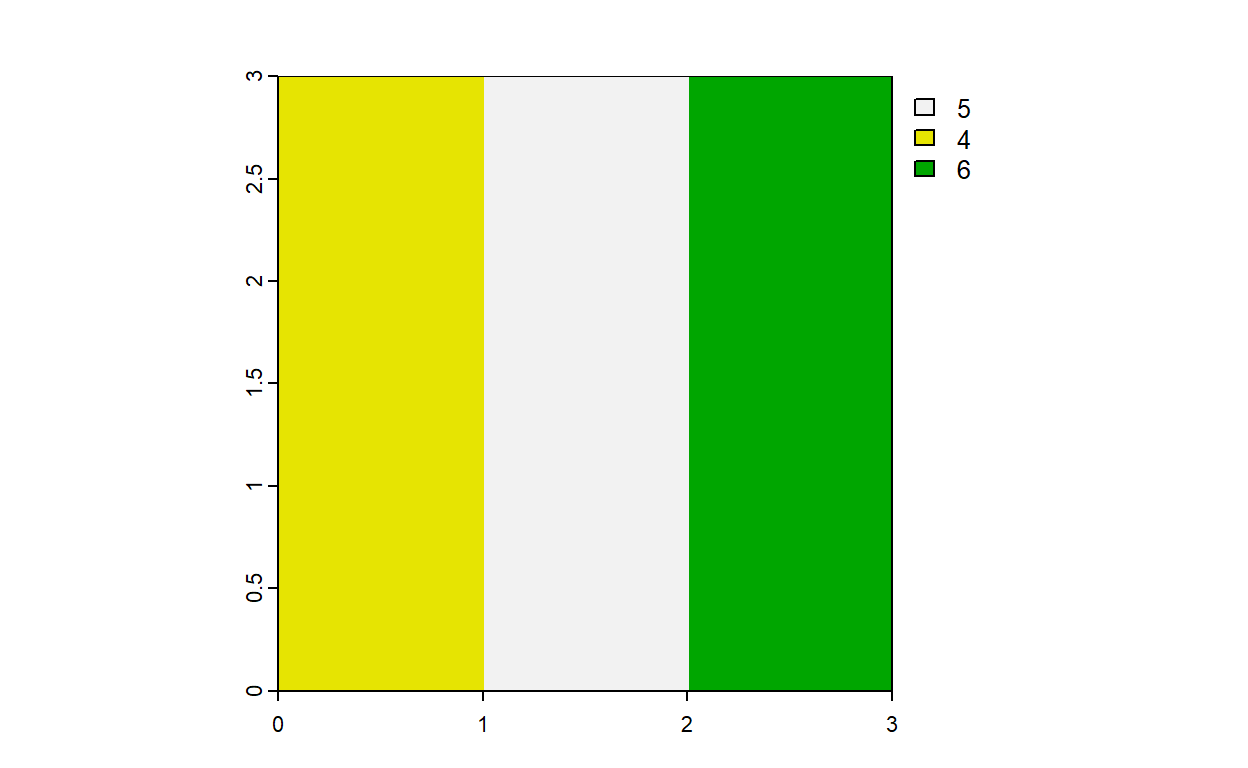
Here we see that the plot show us the numbers we just included, but the raster still reads then as categories
ras_new_cat_2class : SpatRaster
dimensions : 3, 3, 1 (nrow, ncol, nlyr)
resolution : 1, 1 (x, y)
extent : 0, 3, 0, 3 (xmin, xmax, ymin, ymax)
coord. ref. :
source(s) : memory
categories : label, new_label, new_value
name : new_value
min value : 5
max value : 6 # if we use a numerical call, like values for hte cells, we obtain an output that does not correspond with our new numbers
values(ras_new_cat_2) new_value
[1,] 2
[2,] 1
[3,] 3
[4,] 2
[5,] 1
[6,] 3
[7,] 2
[8,] 1
[9,] 3Make the raster numerical
For this we need the function called {catalyze} and the column in the “master table” that actually has the values we want to use as numeric. We specify the column using the index parameter.
# this function activates our desired column of the spatRaster
ras_new_num <- catalyze(ras_new_cat_2, index = 3) # column 3 for new_value

# we select only the correct numerical column for the new raster
ras_new_num <- ras_new_num$new_value

# only the numerical column is left
ras_new_num
class : SpatRaster
dimensions : 3, 3, 1 (nrow, ncol, nlyr)
resolution : 1, 1 (x, y)
extent : 0, 3, 0, 3 (xmin, xmax, ymin, ymax)
coord. ref. :
source(s) : memory
name : new_value
min value : 4
max value : 6 plot(ras_new_num, type = "continuous") # with 'type' we decide to make numerical the legend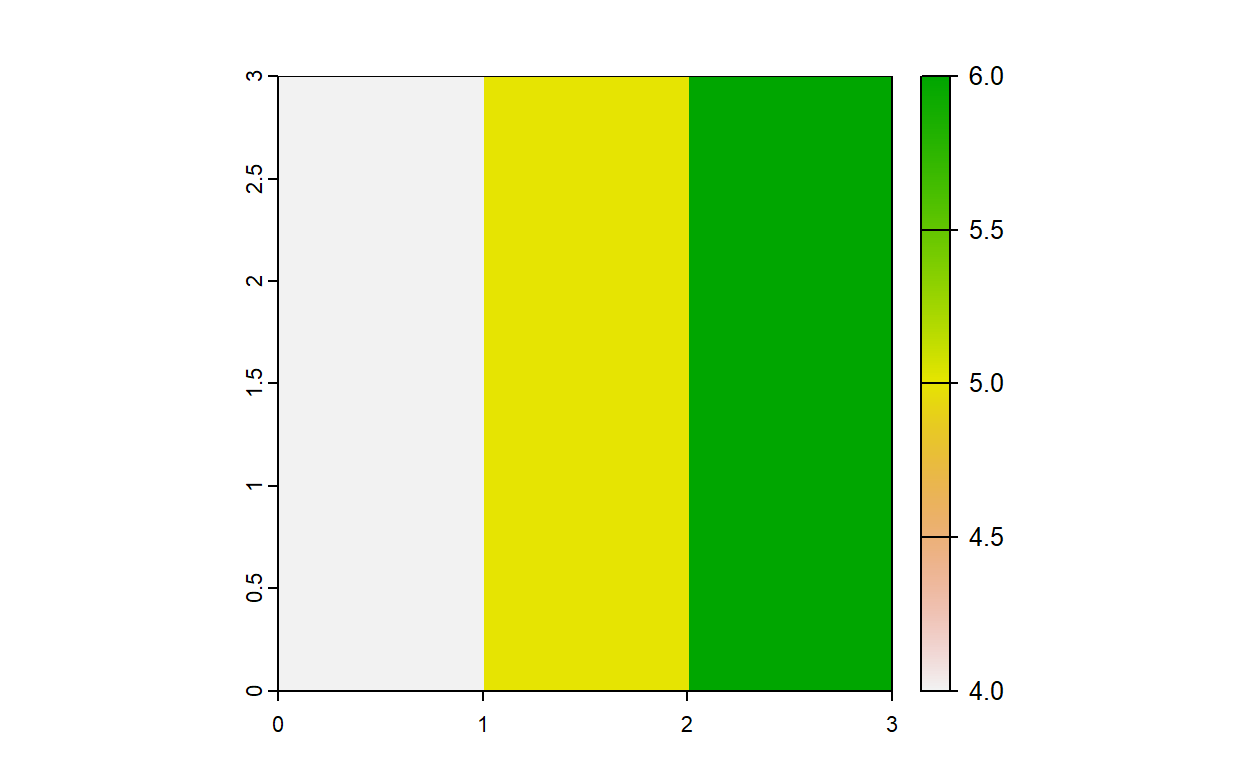
Compare spatRasters
Let’s compare the different spatRasters to see the differences
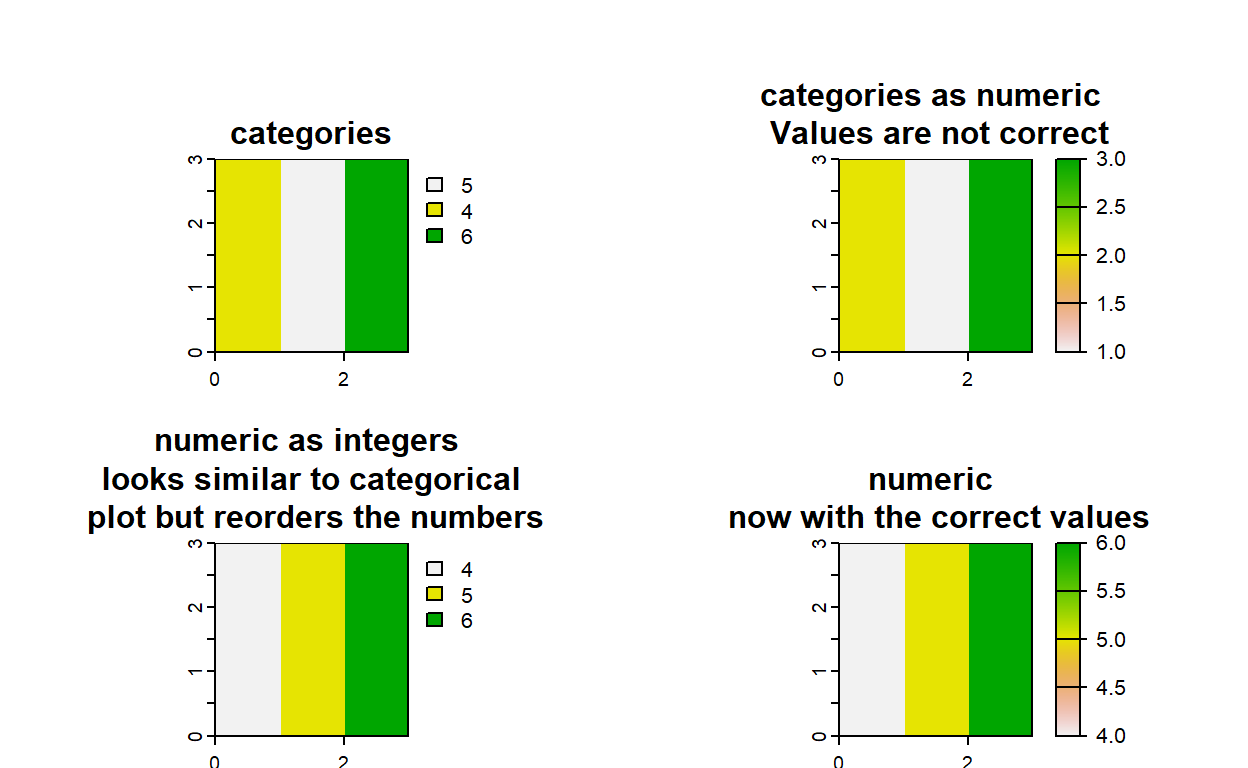
As you can see in the upper right plot that the categories got the internal count value from 1 to 3 instead of the given values.
Compare values
Another way of checking if the correct numerical column is used is to show the categories in the spatRaster.
cats(ras_new_cat_2)[[1]]
value label new_label new_value
1 1 farm d 5
2 2 forest f 4
3 3 urban e 6cats(ras_new_num)[[1]]
NULLThe numeric spatRaster does not have any categories left, as expected.