The {d6berlin} package provides several functions for the members of the Ecological Department of the IZW. Now two functions are added to the package: download_fisbroker_wfs() and download_fisbroker_atom().
install.packages("remotes")
remotes::install_github("EcoDynIZW/d6berlin")
install.packages("rcartocolor")
install.packages("stars")The FIS-Broker database
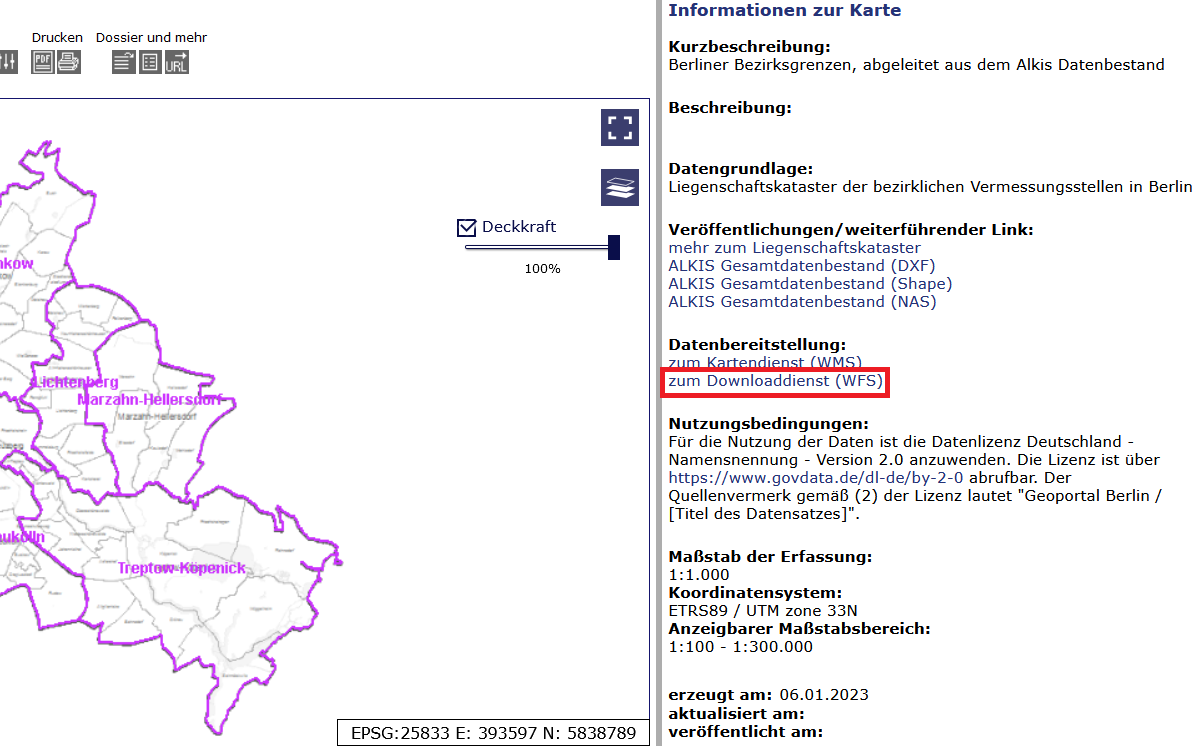
The FIS-Broker database is hosted by the Berlin Senate and provides several geographical data sets. The file formats differ and some data sets have just one of the file formats to offer. The file formats are WMS (Web Media Service: just like a png or jpg), WFS (Web Feature Service: Shapefiles) and ATOM (xml format: raster layers data). This function is only looking for WFS files (shapefiles), because these are the polygons, lines or points that we are looking for.
For using these two functions you have to select the layer you aim to download from the online data base.
WFS Data
As an example we will download the layer containing the districts of Berlin (“ALKIS Bezirke”):
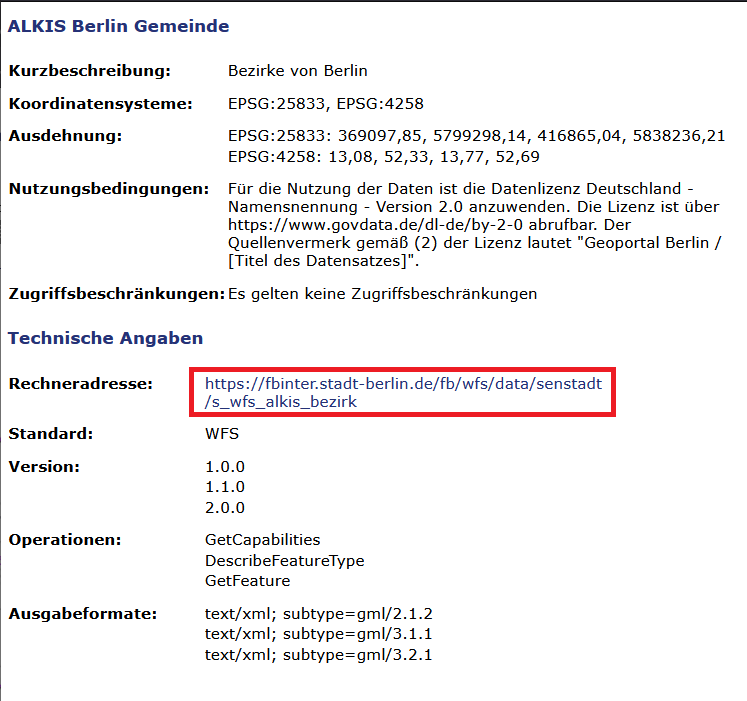
url <- "https://fbinter.stadt-berlin.de/fb/wfs/data/senstadt/s_wfs_alkis_bezirk"

data_wfs <- d6berlin::download_fisbroker_wfs(link = url)
Reading layer `s_wfs_alkis_bezirk' from data source
`https://fbinter.stadt-berlin.de/fb/wfs/data/senstadt/s_wfs_alkis_bezirk?service=wfs&version=2.0.0&request=GetFeature&typenames=s_wfs_alkis_bezirk&srsName=EPSG%3A25833'
using driver `GML'
Simple feature collection with 12 features and 6 fields
Geometry type: MULTIPOLYGON
Dimension: XY
Bounding box: xmin: 370000.8 ymin: 5799521 xmax: 415786.6 ymax: 5837259
Projected CRS: ETRS89 / UTM zone 33Nglimpse(data_wfs)Rows: 12
Columns: 7
$ gml_id <chr> "s_wfs_alkis_bezirk.445", "s_wfs_alkis_bezirk.446", "…
$ gem <int> 3, 12, 8, 10, 6, 9, 4, 1, 11, 7, 5, 2
$ namgem <chr> "Pankow", "Reinickendorf", "Neukölln", "Marzahn-Helle…
$ namlan <chr> "Berlin", "Berlin", "Berlin", "Berlin", "Berlin", "Be…
$ lan <int> 11, 11, 11, 11, 11, 11, 11, 11, 11, 11, 11, 11
$ name <int> 11000003, 11000012, 11000008, 11000010, 11000006, 110…
$ geom <MULTIPOLYGON [m]> MULTIPOLYGON (((399003.5 58..., MULTIPOLYGON (((38999…ggplot() +
geom_sf(data = data_wfs, aes(fill = namgem)) +
rcartocolor::scale_fill_carto_d(palette = "Bold")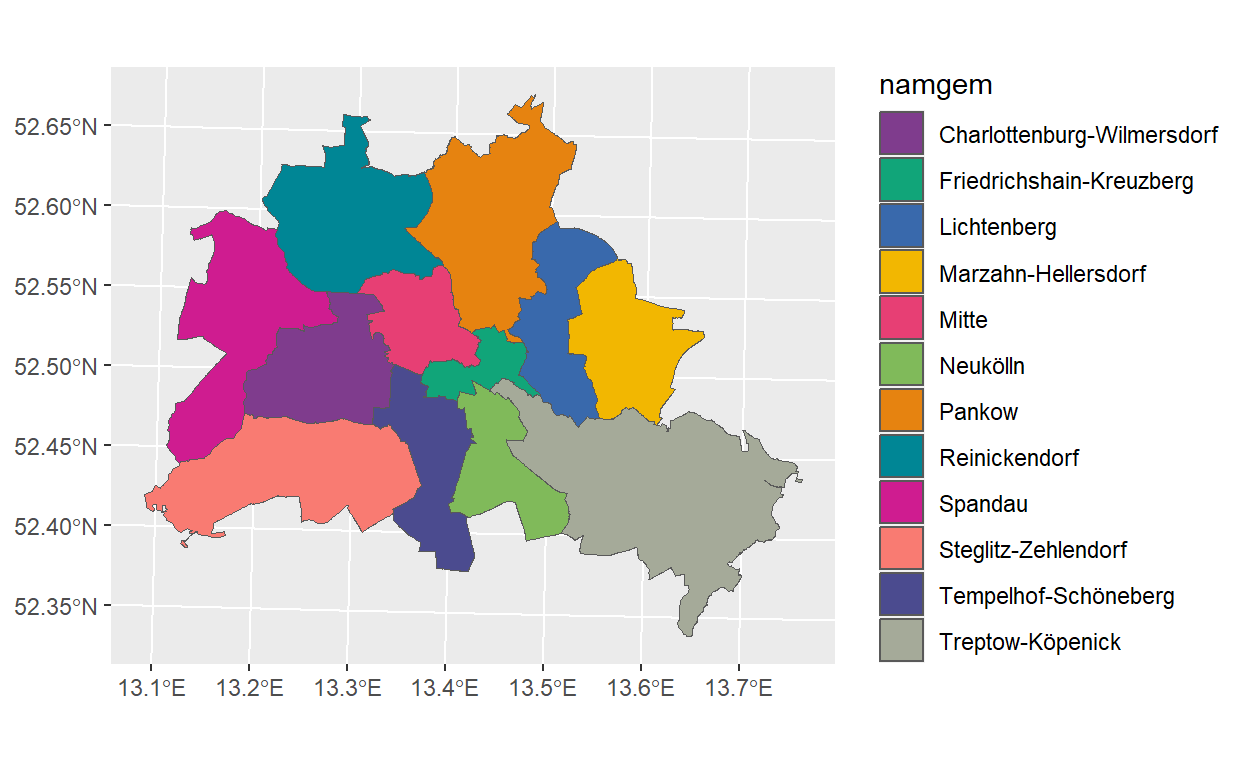
You got a spatial layer which you can save to disk or to use it directly.
ATOM Data
As an example we will download a raster of vegetation heights (“Vegetationshöhen 2020 (Umweltatlas)”):
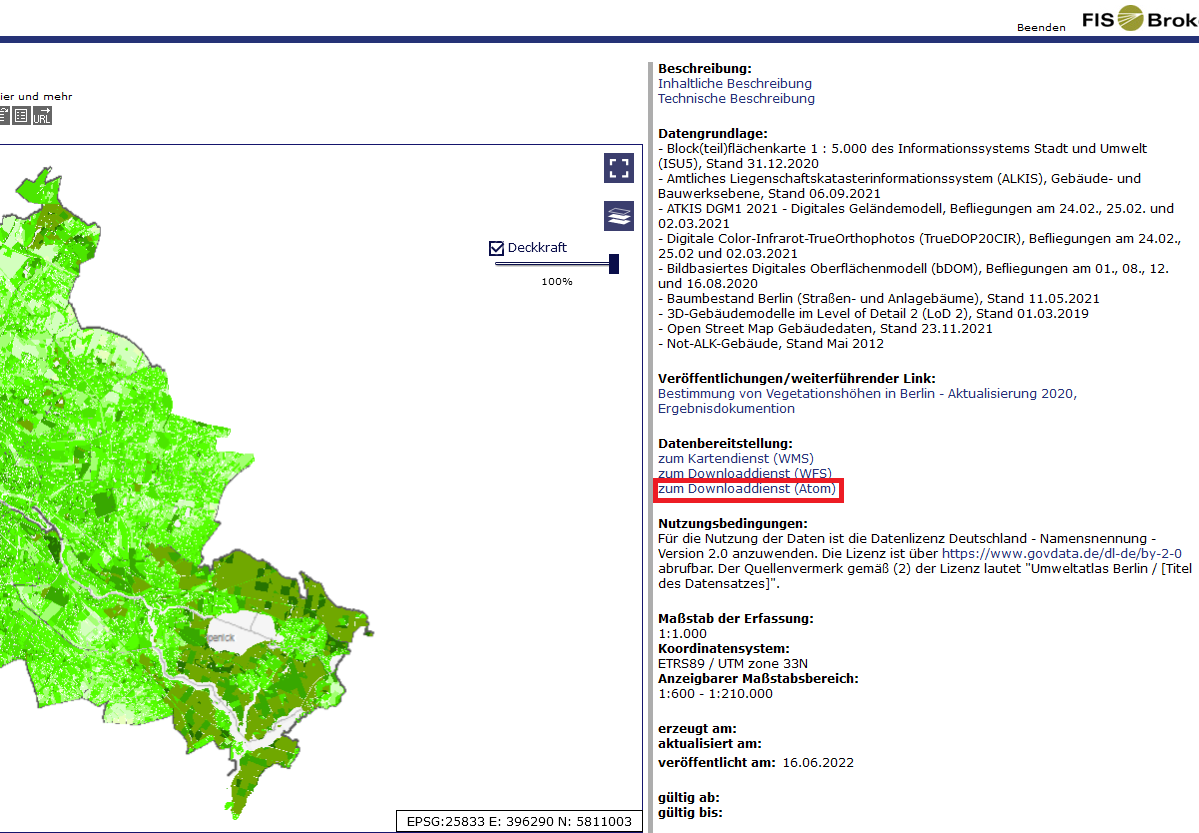
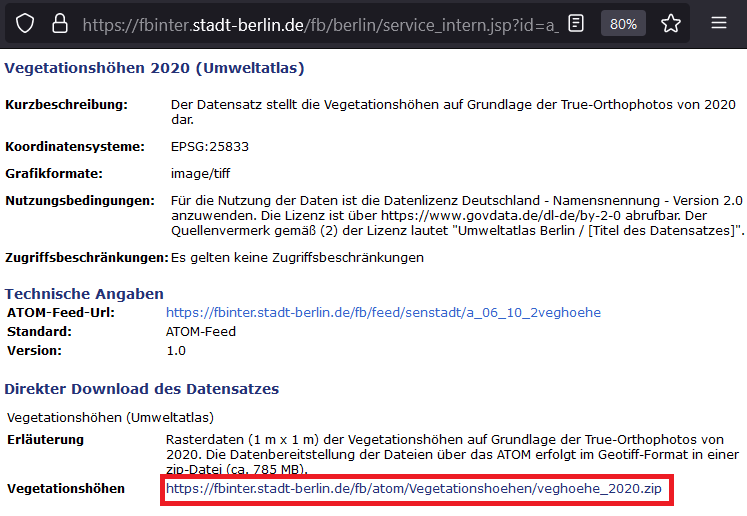
url <- "https://fbinter.stadt-berlin.de/fb/atom/Vegetationshoehen/veghoehe_2020.zip"

data_atom <-
  d6berlin::download_fisbroker_atom(
    zip_link = url,
    path = here::here("_posts", "d6berlin-fisbroker", "man"),
    name = "vegetation_heights"
  )

glimpse(data_atom)
S4 class 'SpatRaster' [package "terra"]data_atom_10 <- terra::aggregate(data_atom, 10)ggplot() +
stars::geom_stars(data = stars::st_as_stars(data_atom_10)) +
coord_sf(expand = FALSE) +
rcartocolor::scale_fill_carto_c(
palette = "Emrld", name = NULL,
guide = guide_legend(label.position = "bottom")
) +
theme_void()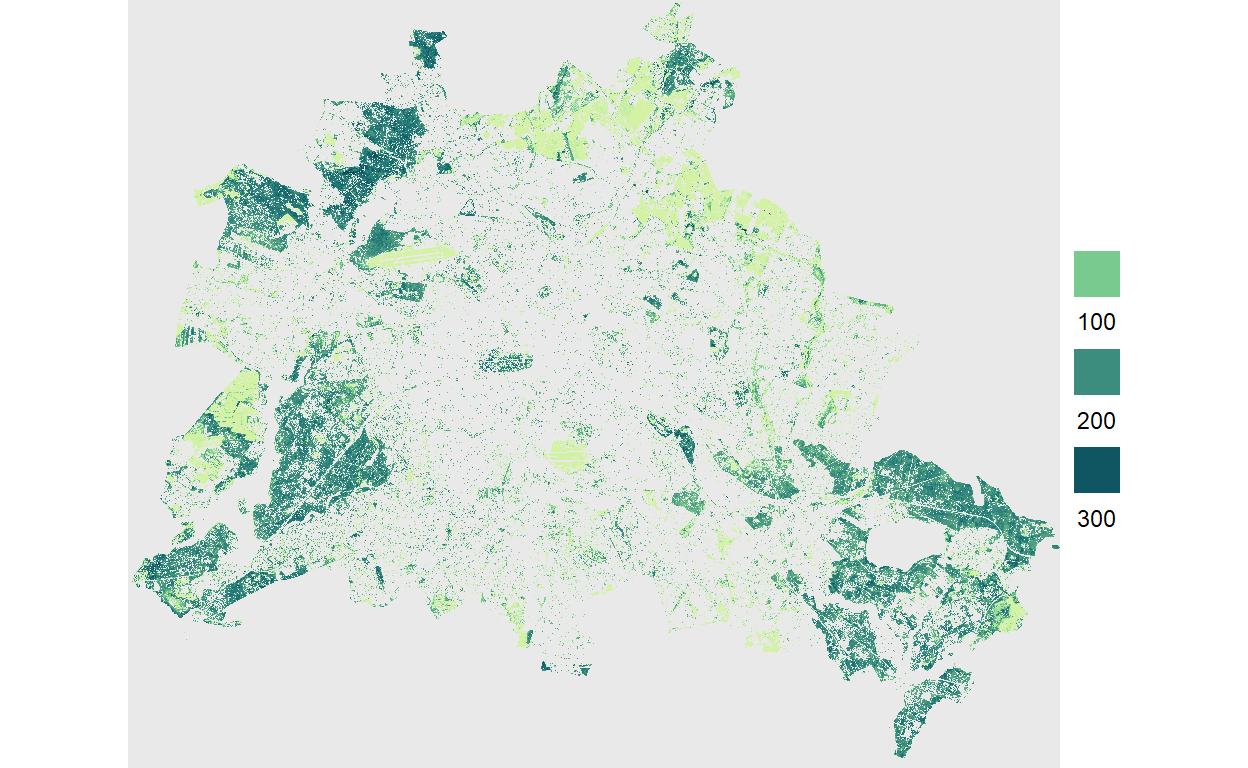
A shortcut to plot this kind of data is the plot_qualitative_map() function from our dedicated {d6geodata} package. You can install this package with devtools::install_github(“EcoDynIZW/d6geodata”).
d6geodata::plot_quantitative_map(tif = data_atom_10)