How to project Netlogo Turtle coordinates into a real map
When using spatial data in Netlogo, the coordinates of a raster get transformed to relative coordinates. This means, the cell in the bottom left gets coordinate (1,1), the one on top of it is (1,2), and so on.
After running a model, usually we want to reproject the output back to the spatial data coordinates used, either for post-simulation analyses or for plotting.
This code shows how to project the turtles’ coordinates back into a map, when a raster was used to create the Netlogo landscape.
For this we need: - The raster used as netlogo input - The turtle coordinates in the output
0. Load libraries
1. Create data
In this example we create a raster and some turtle data to use. With real data, you will load your raster here and make sure it has a PROJECTED coordinate system. Turtle data will have different formats depending how it was created, the basic data we need for this is the identity of the turtle and the coordinates.
## Create raster with 100 cells for the example
myraster <- rast(nrows = 100, ncols = 100,
                 xmin = 4541100, xmax = 4542100,
                 ymin = 3265800, ymax = 3266800)
## give random values to the raster
myraster <- init(myraster, sample(1:1000))

## assign projection
crs(myraster) <- "epsg:3035"
plot(myraster)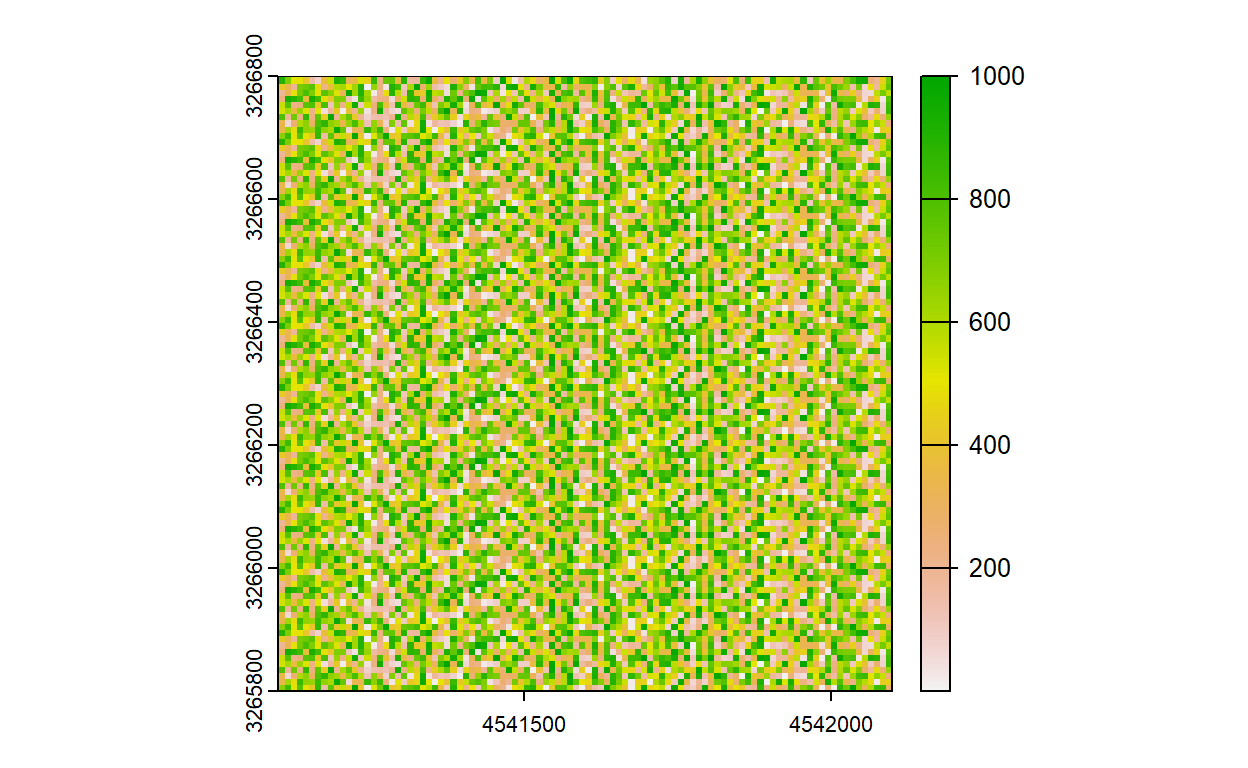
## turtle data - example data
who <- seq(1,10)
xcoord <- sample(1:100, 10) # create random integers for x coordinate
ycoord <- sample(1:100, 10) # create random integers for y coordinate

turtle_variables <- cbind.data.frame(who, xcoord, ycoord)
head(turtle_variables)
who xcoord ycoord
1 1 8 23
2 2 51 97
3 3 87 74
4 4 11 24
5 5 69 26
6 6 68 81Now that we have our data, let’s extract the map coordinates as reference and transform the turtle ones. This process will work with any PROJECTED coordinate system.
2. Get reference coordinates
We need the bottom left corner of the map as a reference point and the resolution of the map
3. Transform turtle coordinates into map coordinates
Now we use the reference point to transform our coordinates into the projected coordinates and the resolution to correct for the size of the cells
turtle_spatial <- turtle_variables %>%
mutate(spatial_xcoord = start_left + ((xcoord * my_res) + my_res/2), #divided by 2 to locate in the center of the cell
spatial_ycoord = start_down + ((ycoord * my_res) + my_res/2))
## make spatial points
turtle_sf <- st_as_sf(turtle_spatial,
coords = c("spatial_xcoord", "spatial_ycoord"),
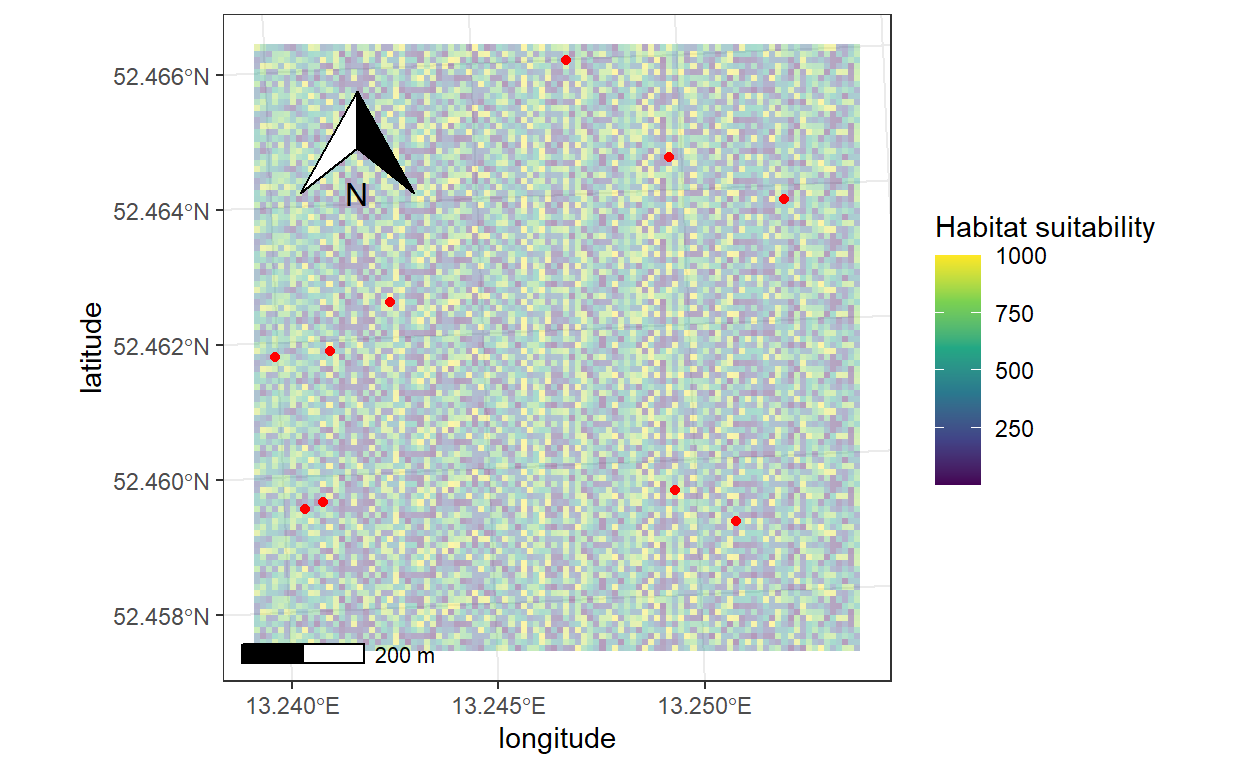
crs = crs(myraster))4. Quick plot with tmap
5. Plot with ggplot2
        x       y  hs
1 4541105 3266795 902
2 4541115 3266795 698
3 4541125 3266795 500
4 4541135 3266795 492
5 4541145 3266795 405
6 4541155 3266795 151